
For additional analytical results, please see our Design Review II Report.
SELECTED ANALYTICAL PLOTS
Foot Trajectory
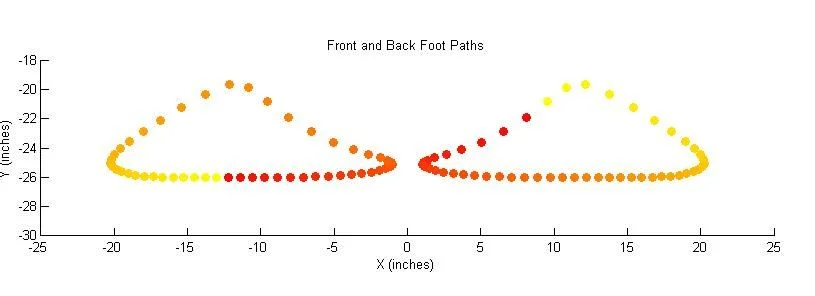
Predicted foot path of front and back leg
Gait Smoothness

Vertical position of front and back foot as a function of the input crank angle
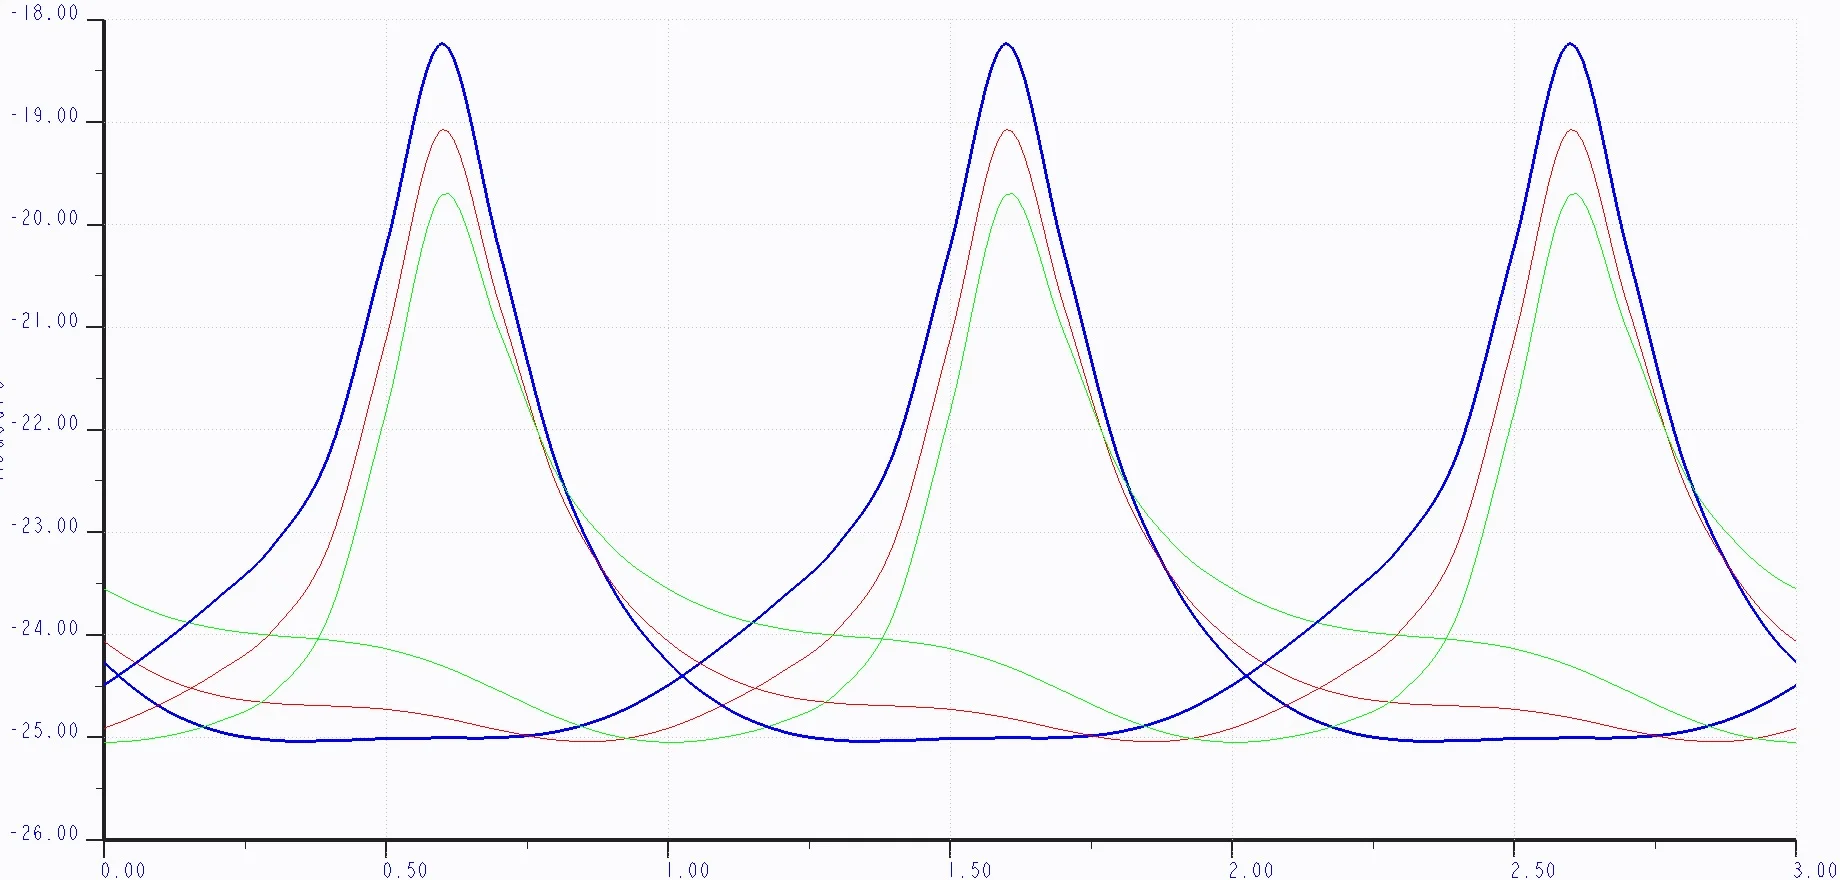
Vertical position of foot with addition of a foot to serve as a gait-smoothening cam. The blue lines represent the original gait, the red and green represent points on the cam. Look for the the lowest point of any of the lines as you look along the x-axis -- there is almost no fluctuation in Y-direction after the addition of the red and green lines (the cam). Thus the gait has been smoothened.
Motion of Leg Linkage
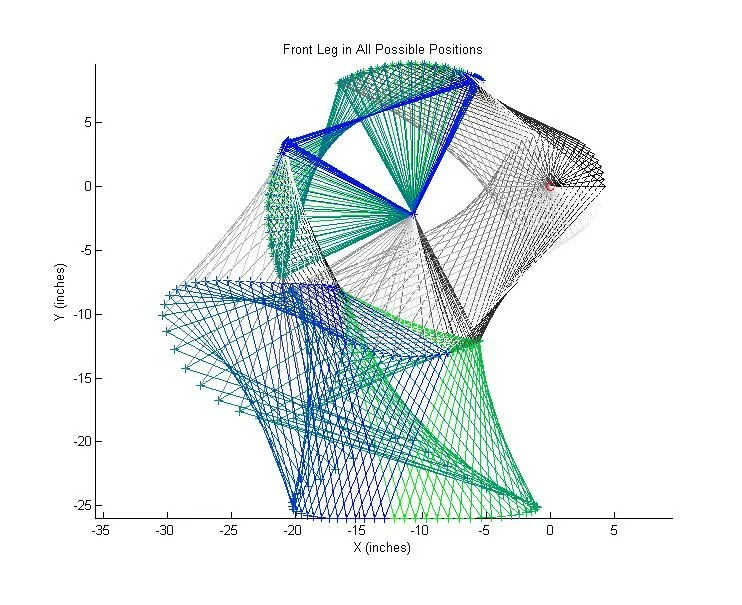
Front leg movement envelope
Static Analysis
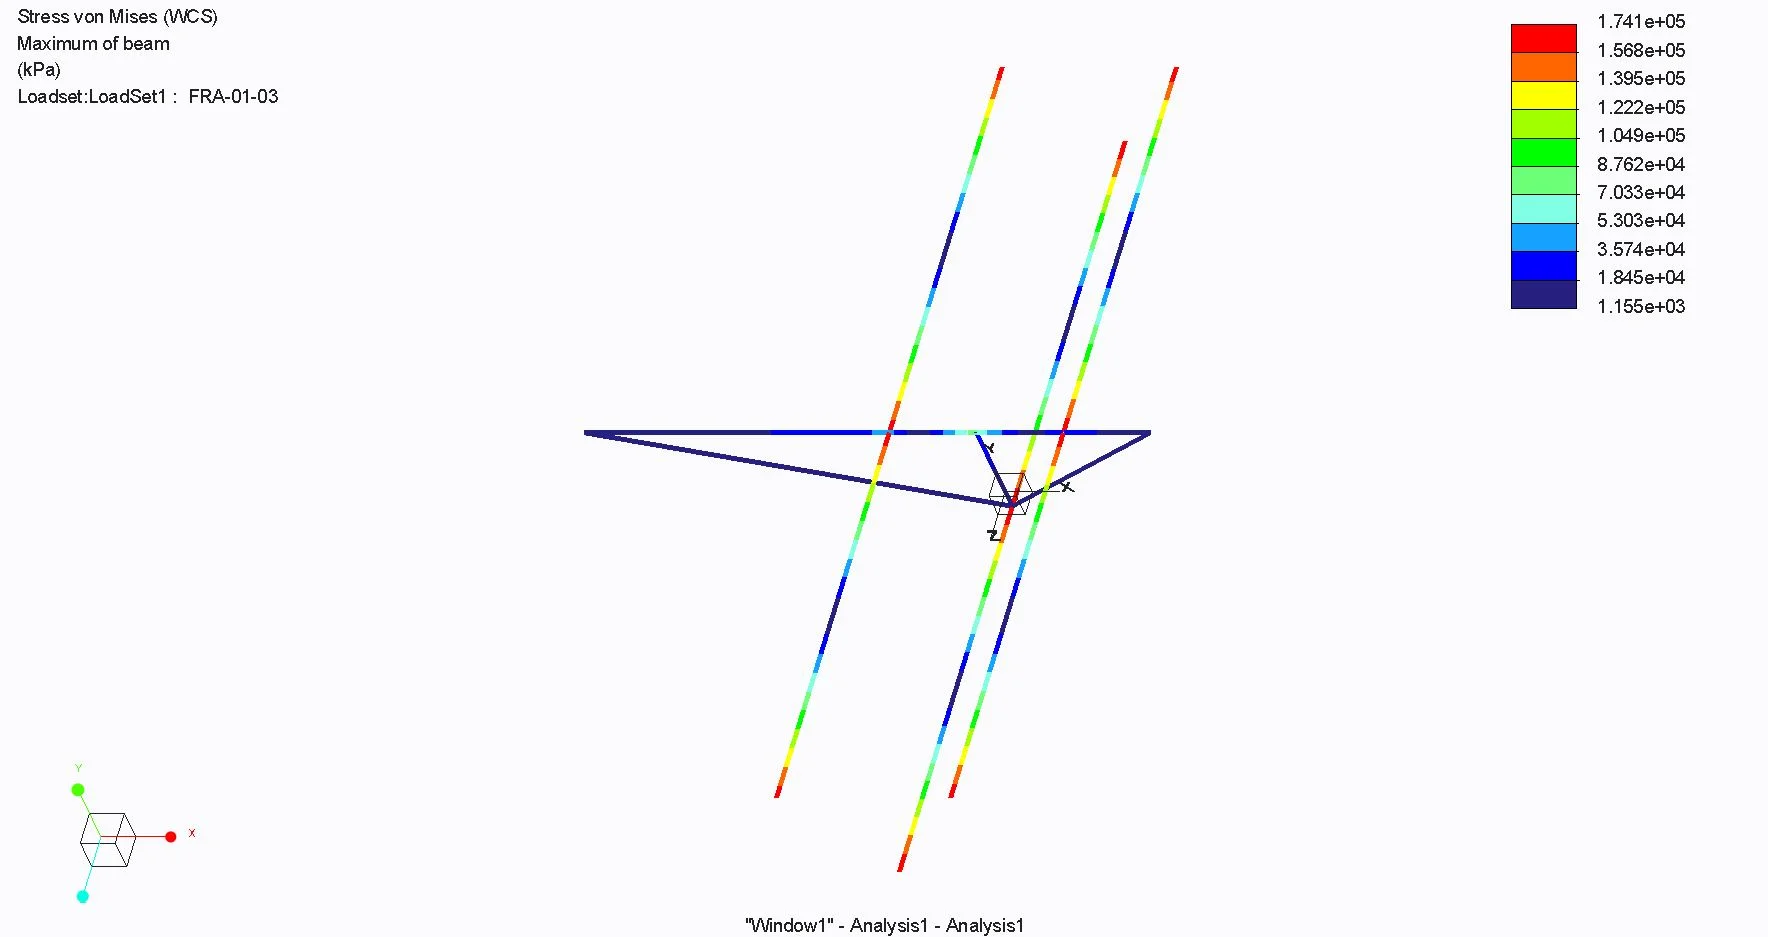
Static analysis of chromoly frame.
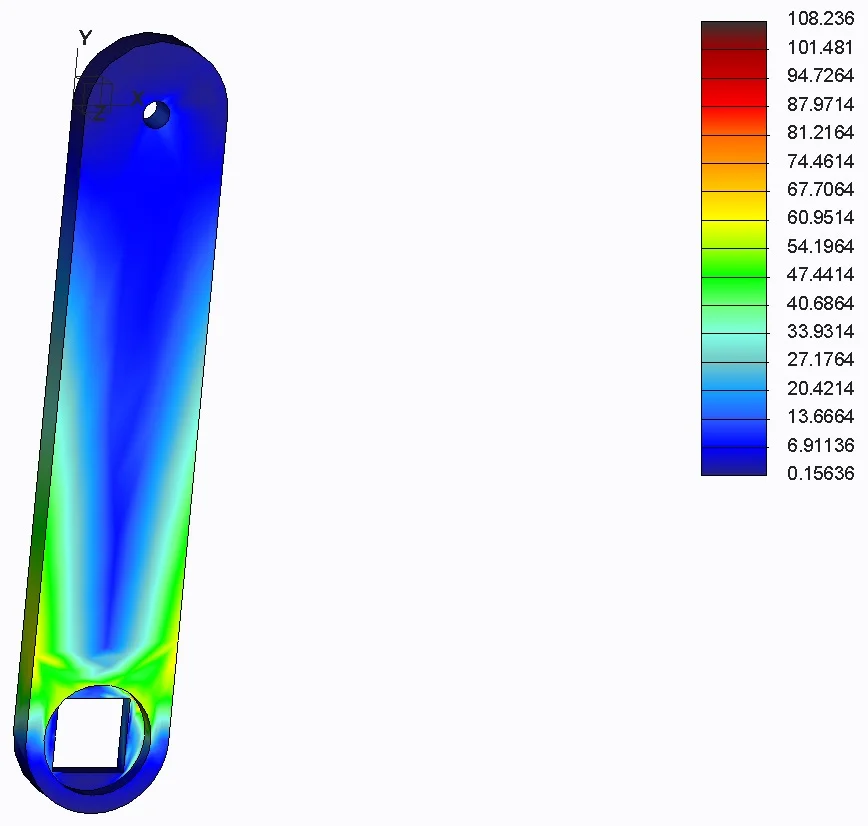
Static analysis on crank arm.
Dynamic Analysis

Forces on each joint in one leg. Note that the maximum force experienced is 180 lbf. This is with loading scenario with a factor of safety of 2.5
Topology Optimization
We used iterative topology optimization to generate strong, lightweight profiles for the structural plates. The method works by performing FEA on the part with specified load scenarios and constraints. It then checks for a design variable (Has the maximum allowable stress been reached somewhere?) and if not, removes material from the model. It iterates through this process until a novel geometry has been achieved.

Generated geometry (colored) with design interpretation -- the final part design (outlined).
In the figures below, you can see the design history of the part. The color represents mesh density (how much material there is at that place).
The main body profile was not used in the end due to time constraints, but it would have been a really interesting geometry.
Testing of Plywood Composite
The analysis in Creo showed that the individual pin joints in the legs would experience about 200 lbf at the most. This was with a loading scenario with a factor of safety of 2.5. To test the actual strength of the plywood, two sets of 3/16" 3-ply test samples were prepared. One set coated with fiberglass, and one without. Both samples were tested with the same pins and bearings that are used in the leg design. The sample was then loaded in the MTS-machine as shown below.

A sample of 3/16" plywood with fiberglass in the MTS. The pin went through a sleeve bearing with 5/16" outer diameter.
After the sample was put in place, we slowly increased the downward force acting on the pin, pausing every 10lbf to look for change/damage in the plywood structure. The load was gradually increased until we observed a lateral displacement on the display of the machine, indicating a failure of the plywood.
As expected, the non-fiberglassed plywood failed first, at 140lbf. The fiberglassed sample did not fail until 385 lbf. We repeated the test with another set of samples, and experienced the same load scenarios, within 5 lbf. From these tests, we concluded that the fiberglass was strong enough to support the expected load scenarios.